Statewide Poll Reveals Opinions on Political Landscape, COVID-19 and Vaccination Perceptions, Ongoing Labor Shortage, and Voting Rights
June 7, 2021“After conducting multiple polls in 2020, the Chamber wanted to reassess how voters feel about Michigan’s health, economy, and political situation,” said Sandy K. Baruah, president and chief executive officer of the Detroit Regional Chamber. “Fifteen months into the pandemic, voters are seeing clear progress in controlling COVID-19 and are broadly receptive to vaccinations but are still reserving judgement about the speed with which they want to return to ‘normal’.”
The Glengariff Group Inc., the Chamber’s polling partner, completed this statewide poll of 600 registered Michigan voters between May 22 and 26, 2021. The poll’s findings reflect some continuity with previous Chamber surveys conducted throughout 2020 and an evolution of Michigan voters’ priorities as vaccinations have become more prevalent, businesses face a labor shortage, and new public policy proposals are released.
“Eight months after the Presidential race, it is clear voters have not moved on. The same dynamics we saw in 2018 and 2020 continue to hold in mid-2021,” said Richard Czuba, president of Glengariff Group Inc. “And perhaps most telling, motivation to vote in the 2022 election already comes in at a strong 9.2 indicating that the 2022 election is likely to continue to see the high levels of turnout we saw in 2018 and 2020.”
The following are some key themes from the polling results:
Understanding Michigan Voter Perceptions on Vaccinations, Returning to the Workplace
How COVID-19 is Still Impacting the Economic Landscape
As Michigan businesses start to return to in-person work following the withdrawal of Michigan Occupational Safety and Health Administration emergency rules at the end of May, voters show they are still interested in taking sensible precautions as they reengage in public economic activity.
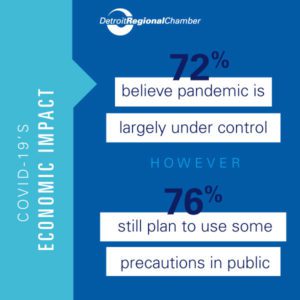
- A significant majority of Michigan voters believe that the pandemic is largely under control (72.2%); however, 75.5% still plan to follow some precautions to keep themselves safe.
- 59.7% of Michigan voters plan to continue wearing a mask at least some of the time in indoor public places, while just over a third of voters will only wear masks indoors if required.
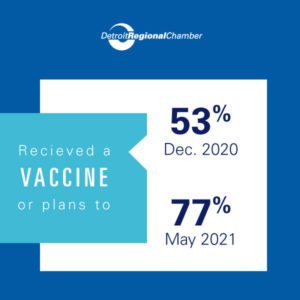
- 77.0% of voters said they have received at least one shot or have a plan to be vaccinated, which represents a strong increase from the 52.5% that said they would in the Chamber’s December poll. This reflects a growing consensus that vaccinations are safe, effective, and the best pathway toward a sustained economic recovery.
Chamber Perspective: As the data shows that a strong majority of 75% of Michiganders still plan to use precautions against COVID-19 in public places, businesses should consider phasing out COVID-19 precautions as a majority of employees and customers will need time to adjust.
While 77% of respondents indicated they have received, or plan to receive, at least their first dose of the vaccine, currently less than 60% have done so, indicating a positive role employers can play in helping to increase vaccination rates.
Messages to Incentivize Increased Vaccinations
- For the 20.0% of voters that said they do not plan on getting vaccinated for COVID-19, there were some avenues for persuasion.
- 21.5% said if their work or school required it.
- 12.4% said if their friends/family told them they had to get it to spend time with them.
- 5.1% said if they needed it to travel again.
- 0.6% said to go to concerts or sports events.
- But 47.5% said there was no reason they would get vaccinated.
- Incentives like lotteries – like the Ohio prize of $1 million to five Ohio residents that had been vaccinated – would only have a minimal impact in motivating hesitant Michigan voters. 5.6% of unvaccinated respondents said it would motivate them to get the vaccine, while 92.1% said it would not motivate them to get the vaccine.
Chamber Perspective: While financial incentives, such as the lottery in Ohio, do not appear to be major motivations for vaccine adoption, an increase of 5% in Michigan’s vaccination rate would be a very positive development.
Workers Want Flexibility
- While more than half of workers have been working at their job site during the pandemic (54.1%), a significant majority of workers (77.4%) would prefer at least some portion of their job be remote.
- 50.4% would prefer working at a combination of work and home.
- 27.0% would prefer working from home.
- 22.0% would prefer working at their job site.
Chamber Perspective: As businesses re-open their doors to employees and customers, the Chamber urges businesses to listen and respond to what employees and customers are saying regarding the comfort of their timing in “returning to normal.” Each business is unique, serving different audiences with different workplace cultures – there is not a “one-size-fits-all” answer.
Understanding Michigan Voter Perceptions on the Economy
Older Voters Helping to Fuel Labor Shortage
- Michigan businesses report significant staffing challenges as the economic recovery accelerates. Respondents gave multiple reasons for the continued barriers to finding employment.
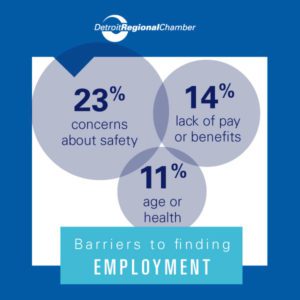
- 22.9% said they did not feel safe or cited COVID-19 safety.
- 14.3% said it was a lack of good pay or benefits.
- 11.4% cited their age or health.
- 11.4% said they have not yet been called back to old jobs.
- 8.6% cited general problems in finding open positions.
- 8.6% cited the need for child care.
- 17.1% did not have an answer.
- In a mini focus group of poll participants who were employed before COVID-19, but now are out of work, only one in 15 respondents cited unemployment benefits as the reason for not returning to work.
- While 76% of people employed before COVID-19 are employed in their same job now, there has been a substantial fluctuation in the labor market.
- 76.0% of people employed before COVID-19 are employed in the same job.
- 12.7% of people employed before COVID-19 are now in a new or different job.
- 4.2% of people employed before COVID-19 are not working or not actively looking for work.
- 3.7% of people are currently looking for work.
- 2.8% of people are waiting to be called back to their old jobs.
- Workers at the later stages of their careers made up a significant demographic of people who were employed before COVID-19 but are no longer looking for a job.
- 13.6% 65 years or older
- 8.6% 50-64 years old
- 9.8% Leaning GOP workers
- 6.8% High school-educated
- 6.1% Outstate workers
- 5.3% Some post-high school-educated
- 5.2% Independent workers
- 5.1% Female workers
Chamber Perspective: The data demonstrates multiple factors are preventing employees from returning to work. While 14.3% of respondents indicated “lack of good pay,” which likely encompasses the impact of the federal $300 weekly supplemental unemployment benefits, other factors are likely the primary reasons for workers not returning to the workplace.
Impact of COVID-19 on Personal Economies Decreases, but Disparities Remain
- Voters described COVID-19’s impact on their household finances. The numbers on the left look at May 2021 compared with December 2020 and May 2020. One in six voters continues to deal with catastrophic or major effects on their household finances.
| May 2021: | Dec. 2020: | May 2020: | Effect: |
| 3.0% | 6.2% | 5.0% | Catastrophic |
| 12.8% | 18.0% | 18.8% | Major effect |
| 34.8% | 34.2% | 46.3% | Minor effect |
| 48.7% | 41.0% | 27.7% | No effect |
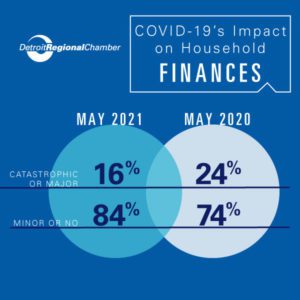 Chamber Perspective: Throughout the pandemic, the data consistently showed a vast majority (roughly 75%) were not impacted financially due to the pandemic or were only minorly impacted. These latest results of 83.5% with no or only minor financial impact are a key reason for the strength of consumer demand and strongly indicate solid economic performance for the balance of 2021 and beyond. The Chamber also notes that while this overall economic picture is largely positive, the negative impacts of the pandemic did not fall equally across our society.
- The most significant impact continues to be on Black voters and those under 30 years old. 29% of Black and 23.1% of 18- to 29-year-old respondents reported catastrophic or major financial damage from COVID-19.
Understanding Michigan Voter Perceptions on Voting Rights and Reform
Michiganders Support Protecting Voting Rights and Election Security
In early April, Michigan House Republicans introduced 39 bills that focused on voting process and access. The Chamber has long advocated for smart voting reforms, such as supporting no-reason absentee voting and same-day voter registration and has taken a stand supporting the validity of the 2020 election.
“This poll also highlighted a nuanced set of views on voting rights and reforms,” said Baruah. “Voters were clear that government leaders should make voting easier and more accessible to individuals, while at the same time initiating reforms to ensure transparency and security throughout the electoral process.”
Some of the measures make common sense improvements and will make the voting process stronger. However, the Chamber issued a statement on April 12, which opposes efforts that unreasonably impact its members and their employees’ ability to exercise this franchise.
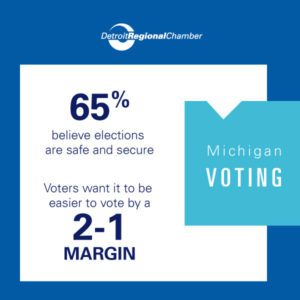
- 51.8% of Michigan voters believe we should make it easier to cast a ballot, while 24.7% of voters believe it should be harder.
- 23.5% of voters did not know.
- By a 2-1 margin, Independent voters believe it should be easier to cast a ballot.
| Party Affiliation | Easier | Harder | Do Not Know |
| Strong Republican | 15.1% | 52.6% | 32.2% |
| Lean Republican | 23.1% | 47.7% | 29.2% |
| Independent | 52.1% | 23.1% | 24.8% |
| Lean Democratic | 68.3% | 1.6% | 30.2% |
| Strong Democratic | 89.0% | 1.7% | 9.2% |
- By a 2-1 margin, voters over 65 believe it should be easier to cast a ballot
- By a margin of 64.7%-28.7%, Michigan voters believe the state generally has safe and secure elections.
| Party Affiliation | Safe/Secure | Not Safe/Secure |
| Strong Republican | 34.9% | 56.6% |
| Lean Republican | 40.0% | 53.8% |
| Independent | 57.9% | 31.4% |
| Lean Democratic | 88.9% | 6.3% |
| Strong Democratic | 96.5% | 2.3% |
- Most Michigan voters have not seen or heard about the 39-bill package on voting restrictions and reforms (71.3%). Of the voters that have heard about the bills, 14.5% view them unfavorably compared with 8.5% that have a favorable opinion.
“By a wide margin, Michigan voters agree with the Chamber that any voting reforms should be bipartisan, ensure that elections are secure, and protect access to the ballot,” said Baruah.
Bipartisan Support for Four of Nine Proposed Michigan Voting Laws
Respondents were asked about nine different proposed voting law changes in Michigan and asked if they support or oppose the change.
| Support | Oppose | Proposal |
| 79.7% | 16.2% | Require that every voter coming to the polls present a government-issued identification to cast their ballot. |
| 79.0% | 18.3% | Allow young adults who are getting their driver’s license to pre- register to vote so that are already registered when they turn 18. |
| 71.2% | 18.8% | Allow clerks to prepare absentee ballots ahead of time, like in Florida, or should they continue following Michigan law, which allows them to begin preparing absentee ballots the day before the election. |
| 66.8% | 24.7% | Require that in addition to Election Day voting hours, local clerks must be open for voting hours the second Saturday before Election Day. |
| 51.0% | 42.7% | Require that voters using absentee ballots would also have to send a copy of their government identification or bring it in to the local clerk before their absentee ballot is counted. |
| 42.6% | 52.5% | Require drop boxes to close by 5 p.m. the day before an election and prohibit drop boxes from being used on Election Day. |
| 40.2% | 54.8% | Prohibit the Secretary of State or county clerks from mailing applications for absentee ballots or mailing postcards with information about how to apply online for an absentee ballot without individuals first requesting the information. |
| 35.7% | 56.5% | Prohibit local clerks from sending absentee ballots with the return postage already included to voters that have requested an absentee ballot. |
| 24.0% | 71.4% | Require that all counting of ballots be done by noon the day after the election regardless of whether the count is completed or not. |
Four Proposals Have Majority Bipartisan Support
- By a margin of 79.7%-16.2%, Michigan voters overwhelmingly support requiring voters to present a government ID when voting in person. A majority of every demographic group supports a government ID for in-person voting.
- 100% of Strong Republican voters support the ID requirement.
- 83.4% of Independent voters support the ID requirement.
- 58.4% of Strong Democratic voters support the ID requirement.
- By a margin of 79.0%-18.3%, Michigan voters overwhelmingly support allowing young adults applying for their driver’s license to pre-register to vote so that are already registered when they turn 18.
- 91.4% of Strong Democratic voters support the proposal.
- 78.6% of Independent voters support the proposal.
- 66.5% of Strong Republican voters support the proposal.
- 71.2% of Michigan voters believe local clerks should be allowed to prepare absentee ballots for counting as they are returned, like Florida.
- 18.8% of Michigan voters believe clerks should be allowed to begin verifying and preparing absentee ballots one day prior to Election Day.
- 80.4% of Strong Democrats believe they should be counted as they come in.
- 66.1% of Independent voters believe they should be counted as they come in.
- 66.4% of Strong Republicans believe they should be counted as they come in.
- By a margin of 66.8%-24.7%, Michigan voters believe clerks should be required to be open for voting hours the second Saturday before Election Day.
- 86.2% of Strong Democratic voters support Saturday voting hours.
- 69.4% of Independent voters support Saturday voting hours.
- Strong Republican voters narrowly support Saturday voting hours by a margin of 47.4%-45.4%. Leaning GOP voters support the voting hours by a margin of 55.4%-35.4%.
Two Proposals Split Voters, But Both Have Strong Senior Opposition
Two proposals split voters, with one having a slight majority support and one having a slight majority opposition.
- By a margin of 51.0%-42.7%, Michigan voters narrowly support requiring absentee ballot voters to send a copy of their government identification with their absentee ballot. However, voters over the age of 65 oppose this proposal by a margin of 39.9%-54.6% – with 47.6% strongly opposing the proposal.
- By a margin of 42.6%-52.5%, Michigan voters narrowly oppose prohibiting drop boxes from being used on Election Day for absentee ballots. The strongest opposition came from voters over the age of 65, by a margin of 29.4%-66.4% – with 57.3% of senior voters strongly opposed to this proposal.
Three Proposals Face a Majority of Voter Opposition
- By a margin of 40.2%-54.8%, Michigan voters oppose prohibiting the Secretary of State or county clerks from mailing applications for absentee ballots to voters or mailing postcards with information about how to apply online for an absentee ballot.
- Strong Republican voters support this proposal 57.9%-35.3%
- Independent voters oppose this proposal 42.3%-54.5%.
- Strong Democratic voters oppose this proposal 24.9%-72.2%.
- By a margin of 35.7%-56.5%, Michigan voters oppose prohibiting local clerks from sending absentee ballots with the return postage already included to voters that have requested an absentee ballot.
- Strong Republican voters narrowly support this proposal 49.4%-43.1%.
- Independent voters oppose this proposal 38.0%-52.1%.
- Strong Democratic voters oppose this proposal 20.8%-73.1%.
- By a margin of 24.0%-71.4%, Michigan voters strongly oppose a requirement that all counting of ballots must be complete by noon the day after Election Day regardless of whether the count is completed or not. 62.2% of voters strongly oppose this proposal.
- Strong Republican voters only narrowly oppose this proposal by a margin of 42.1%-52.7%.
- Independent voters strongly oppose this proposal 22.3%-71.1%.
- Strong Democratic voters oppose this proposal 7.6%-91.3%.
Chamber Perspective: The data indicates that Michiganders are not aligned with several of the voting rights proposals currently being discussed by the legislature, and generally, respondents are looking to make voting easier, not harder. The Chamber believes this data demonstrates there is a potential a pathway to bipartisan solutions, including on sensitive issues such as voter ID, if the parties are willing to work together.
Understanding Michigan Voter Perceptions on the Political Landscape
Gov. Whitmer Approval Rating Declines, But Still at 50.0%
- Michigan voters continue to approve of Gov. Whitmer by 50%-43.8%; however, this represents the first time since the onset of the COVID-19 pandemic that her job approval numbers have statistically declined.
- Gov. Whitmer’s approval numbers fell 7.8% since February 2021, while her disapproval number climbed 5.7% since February 2021.
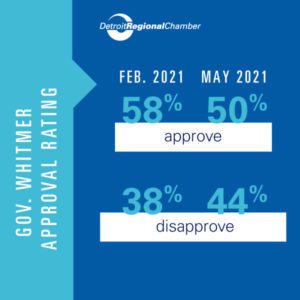
Gov. Whitmer Job Approval
| Time Period | Jan. 2020 | Sept. 2020 | Oct. 2020 | Feb. 2021 | May 2021 |
| Favorable | 43.3% | 58.7% | 59.1% | 57.8% | 50.0% |
| Unfavorable | 35.9% | 38.3% | 37.2% | 38.1% | 43.8% |
The sharpest shift in Gov. Whitmer’s job performance comes among Independent voters who went from 56.3%-37.1% in February 2021 to 43.8%-45.8% in May 2021. Women approve of Gov. Whitmer’s performance by a margin of 57.0%-36.9%. Men disapprove of Gov. Whitmer’s performance by a margin of 42.3%-51.4%.
| Party Affiliation | Approve | Disapprove |
| Strong Democratic | 91.9% | 4.6% |
| Lean Democratic | 85.7% | 9.5% |
| Independent | 43.8% | 45.8% |
| Lean Republican | 15.4% | 73.9% |
| Strong Republican | 7.9% | 90.1% |
National Picture Shows Strong Motivation to Vote and Strong Partisan Divide
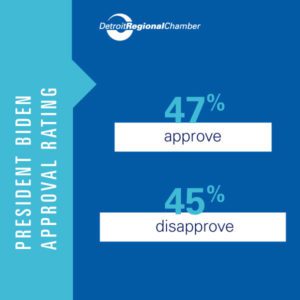
- President Joe Biden’s Michigan job approval is 47.4% approve to 45.0% disapprove. The poll showed 7.7% of voters have no opinion of President Biden’s performance. While 28.2% strongly approve of Biden’s performance, 36.8% of voters strongly disapprove of his performance. The President’s job performance numbers reflect the closeness of last November’s race; voters have still not moved beyond the presidential race.
- Michigan voters of all ages report a strong motivation to cast a ballot in the November 2022 election for governor. Voters rated their motivation on a 10-point scale, and 18 months before Election Day 2022, there is a motivation level higher than 2018 and almost on par with the 2020 presidential election.
- Motivation among Strong Democratic voters continues at 2020 levels at 9.6 while Strong Republican voters are at 9.3.
| Party Affiliation | Motivation to Vote |
| Strong Democratic | 9.6 |
| Lean Democratic | 9.1 |
| Independent | 8.8 |
| Lean Republican | 9.2 |
| Strong Republican | 9.3 |
Concern About the Direction United States and Michigan Are Headed
- After 15 months of the COVID-19 public health crisis, a national election, pandemic-induced economic shutdowns, and ongoing unrest over civil rights, there are concerns about the direction in which the country is headed.
- By a margin of 35.3%-48.2%, Michigan voters believe the nation continues to be on the wrong track. While the “right track” number is statistically consistent with February 2021, the “wrong track” number has increased by seven points.
| Survey | Right Track | Wrong Track | No Opinion |
| Oct. 2020 | 27.4% | 55.9% | 16.7% |
| Feb. 2021 | 36.6% | 40.6% | 22.9% |
| May 2021 | 35.3% | 48.2% | 16.5% |
- The national right track/wrong track sentiments continue to be driven by a sharp partisan divide. However, Independent voters continue to believe the nation is on the wrong track by a margin of 28.9%-48.8%.
| Party Affiliation | Right Track | Wrong Track |
| Strong Democratic | 69.9% | 15.0% |
| Lean Democratic | 54.0% | 17.5% |
| Independent | 28.9% | 48.8% |
| Lean Republican | 10.8% | 75.4% |
| Strong Republican | 4.6% | 86.8% |
- By a margin of 40.4% right track to 45.2% wrong track, Michigan voters believe the state is narrowly on the wrong track. These numbers represent a six-point drop in right track and a six-point increase in wrong track. The shift is reflective of a minor softening of right track among Democratic voters and an eight-point drop among Independent voters.
| Survey | Right Track | Wrong Track |
| January 2020 | 44.5% | 26.2% |
| October 2020 | 44.9% | 41.3% |
| February 2021 | 46.6% | 38.9% |
| May 2021 | 40.4% | 45.2% |
