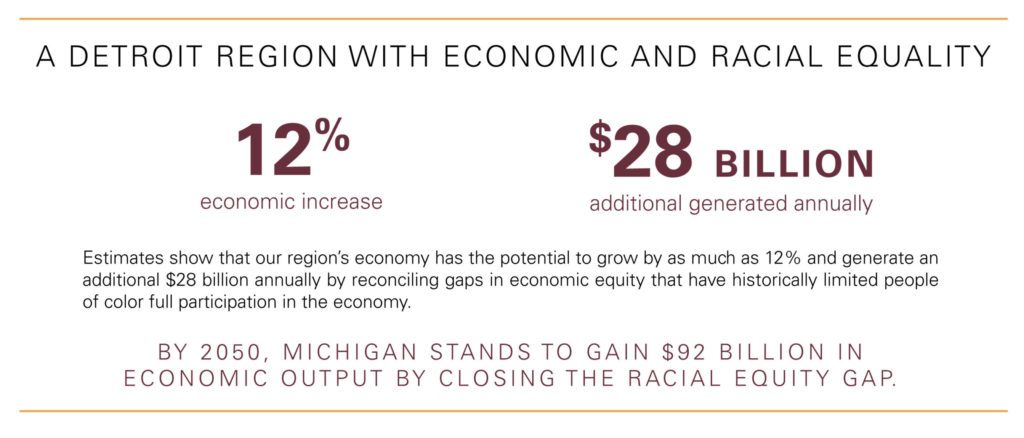
The ideal Detroit Region is an equitable and fair community where everyone has the opportunities, resources, and tools to participate and prosper. To build a strong economy and drive economic growth, leaders in the private and public sectors need to advance racial equity. According to PolicyLink, estimates show that the Region’s economy can grow by as much as 12% and generate an additional $28 billion annually by reconciling gaps in economic equity that have historically limited people of color from full participation in the economy. W.K. Kellogg Foundation reports that by 2050, Michigan stands to gain $92 billion in economic output by closing the racial equity gap.

As the conversation continues to move forward, data is key to determining how to close these gaps. The Chamber’s Data and Research team highlights how the Region is doing on key measures of inclusive prosperity.
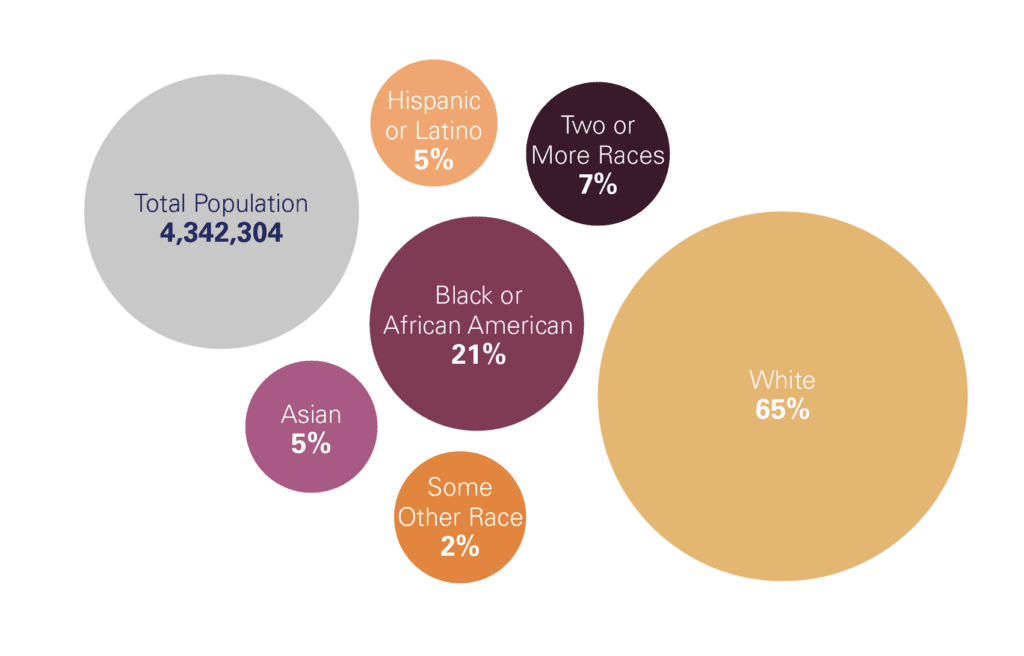
Share of the Population
- In 2023, the Detroit Region’s population was 65% white residents, with Black or African American residents accounting for 21% and Latino or Hispanic and Asian residents accounting for 5% each. The Region has a higher share of the Black or African population compared to the national share of 12%.
Expand for Data
- Median Household Income
-
AVERAGE INCOME INCREASED FOR ALL RACES AND ETHNIC GROUPS, BUT INEQUITIES PERSIST IN INCOMES IN THE DETROIT REGION
WHAT IT SHOWS:
- In 2023, the median household income increased for all races year-over-year. Hispanic or Latino households experienced the largest increase in income at 13.6%, followed by Black or African American (7.1%), Asian (0.5%), and white (0.3%).
- While income increased for all races and ethnic groups, disparities remain stark. The income gap between Asian households and Black households is nearly $67,000, and the income gap between white and Black households is nearly $35,000.
WHY IT MATTERS:
- An increase in income inequality matters because of the potential for social and economic consequences in the Region.
- Unemployment Rate
-
BLACK OR AFRICAN AMERICAN POPULATION HAD THE LARGEST DECLINE IN UNEMPLOYMENT RATE YEAR-OVER-YEAR BUT REMAINS RELATIVELY HIGH
WHAT IT SHOWS:
- In 2023, the Black or African American unemployment rate decreased by almost two percentage points year-over-year — the largest decline among racial groups. Despite the decrease, Black or African American adults still reflect the highest unemployment among major racial and ethnic groups in the region.
WHY IT MATTERS:
- Unemployment rate measures the percentage of people over 16 years old who are not working but are available and actively looking for work. Ensuring true full employment would reduce economic inequities and poverty while boosting workers’ bargaining power and creating a stronger economy.
- Labor Force Participation Rate
-
BLACK OR AFRICAN AMERICAN WORKERS HAD THE LARGEST UPTICK IN LABOR FORCE PARTICIPATION
WHAT IT SHOWS:
- In 2023, labor force participation rates were highest among Hispanic or Latino (68%) and Asian (67%) workers. Black workers showed the largest year-over-year increase (1.6 p.p.) in participation to 61% in 2023.
WHY IT MATTERS:
- The labor force participation rate measures the percentage of the working-age population that is either employed or actively seeking employment. A high participation rate indicates that a larger proportion of the population is actively contributing to the economy through employment. This can increase productivity and consumer spending and lead to overall economic expansion.
- Poverty Rate
-
BLACK OR AFRICAN AMERICAN RESIDENTS FACE POVERTY AT HIGHER RATES COMPARED TO OTHER RACIAL AND ETHNIC GROUPS
WHAT IT SHOWS:
- In 2023, the Black or African American population experienced the largest decrease in poverty (2.0 p.p.). Nearly a quarter of Black individuals in the Region are below the poverty line, over 10 percentage points higher than the national rate.
WHY IT MATTERS:
- Poverty is an important indicator of economic well-being. Federal and state policymakers, as well as community stakeholders, often use poverty rates to identify communities in need and estimate the number of families eligible for government programs.
- Black and Hispanic families consistently experience higher levels of poverty, especially when compared with their white counterparts. Ongoing factors like decades of disinvestment in social programs, discriminatory hiring practices, and disparities in generation wealth have also contributed to poverty.
- Educational Attainment
-
BLACK OR AFRICAN AMERICAN ADULTS SEE LARGEST YEAR-OVER-YEAR INCREASE, BUT DISPARITIES CONTINUE TO PERSIST
WHAT IT SHOWS:
- While Black adults experienced the largest year-over-year increase in 2023 at three percentage points, the educational attainment of Black or African American adults (30%) still reflects the lowest attainment among major racial and ethnic groups in the Detroit Region.
- Asian adults in the Region were most likely to hold an associate degree or higher (70%).
WHY IT MATTERS:
- Higher wage jobs require ever-higher levels of skills and education. Closing wide, persistent racial gaps in educational attainment is key to building a strong workforce.
- Chamber programs like the Detroit Promise, which offers tuition-free college access for Detroit high school graduates; Detroit Reconnect, which helps adults pursue higher education; and Detroit Drives Degrees, which works on reaching 60% postsecondary attainment in the Region while cutting the equity gap in half.
- Homeownership Rate
-
BLACK OR AFRICAN AMERICAN HOMEOWNERSHIP AMONG THE LOWEST IN THE REGION, BUT LARGE GAINS SEEN IN 2023
WHAT IT SHOWS:
- In 2023, Black or African American households in the Region had the lowest homeownership rate at 50%, almost 15 percentage points lower than the national average.
- Black or African American (4.4 p.p.) and Hispanic or Latino (2.3 p.p.) households saw the largest increase in homeownership year-over-year in 2023.
WHY IT MATTERS:
- Homeownership can be a critical pathway to economic security and mobility. Income gaps among races, along with discriminatory housing policies such as redlining, have prevented generations of Black or African Americans from purchasing homes and increasing wealth.
Source:
U.S. Census, 2023 American Community Survey 1-Year Estimates Note: Income not adjusted for inflation.
Partners and Funders


Learn how the Chamber is committed to economic equity and inclusion.


